

With the latest release of pForecast, back in December 2023, we introduced a new feature regarding well intervention. This feature allows you to set up a well intervention schedule to quickly analyse how the intervention will influence your current forecast while still considering constraints and uncertainties for the forecast. Compare different scenarios, to get instant insights into whether an intervention campaign is beneficial to your operations or not.
A well intervention is an operation that is performed on the well within its operational lifetime. The objective for performing a well intervention is to perform maintenance on installed equipment, improve well performance, improve well integrity, or acquire data about the well or near-well area.
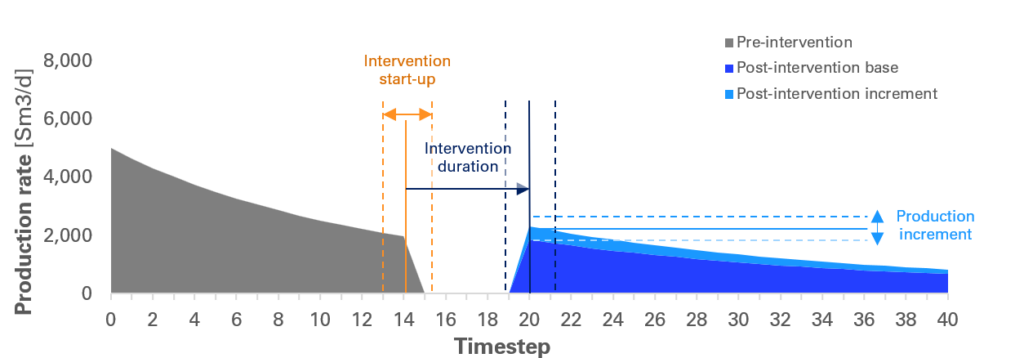
After it has been decided when the intervention job starts and how long it lasts, the production increase needs to be modelled. For this, a production increment is added to the well’s base production potential. The model accounts for uncertainty related to both the base production and the increment. The impact of well interventions can be significant for a field or an asset and should, therefore, be reflected in its production forecast.
The well is shut in temporarily during the intervention operation. When the well starts producing again, it continues producing according to its initial base production potential, plus an incremental production potential. The key uncertainties are related to the timing of the production shut-in and the size of the incremental production potential, as seen in the figure below.
Bear in mind that the result may also be affected by uncertainties applied to the previous wells in the schedule. In addition to the wells being intervened, nearby wells, or offset wells, may be temporarily shut in during the operation. These shut-ins are also reflected in the production forecasts of pForecast. Running a stochastic analysis based on the Monte Carlo simulation approach, pForecast presents various uncertainty estimates (such as percentiles) for the resulting production as well as the timing of the interventions. The latter is illustrated in a Gantt-like chart.

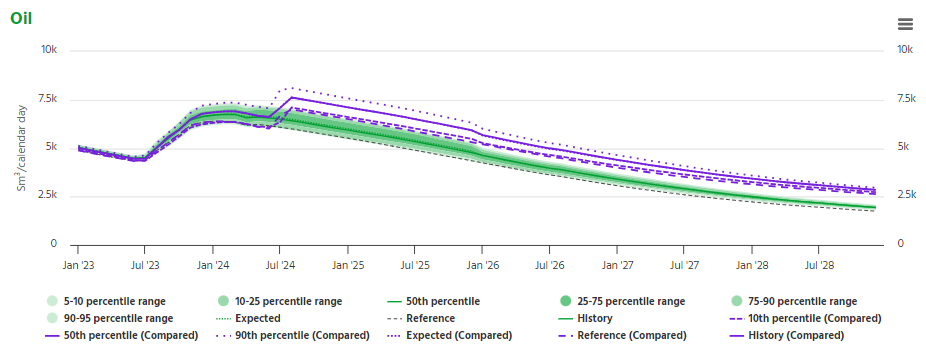
Another great feature of pForecast allows you to compare one result set with another, as shown in the figure below. The chart has one result set with green lines, the scenario without intervention, and the other result set with purple lines is the scenario including a suggested intervention campaign. This allows you to quickly evaluate the benefits or drawbacks of potential intervention campaign.
If you like to know more about how pForecast supports this feature, book your demo here: